Welcome to Visual Finance where a picture is worth 1000 numbers!
Click on a company name to bring up their financial results in Visual Finance format. See a company's structure and identify its strengths and weaknesses in a way you have never done before!
Features include year-over-year results, Key Ratios overlay, language selection, and Competitor selection.
Click here to learn how to use the Visual Finance app.
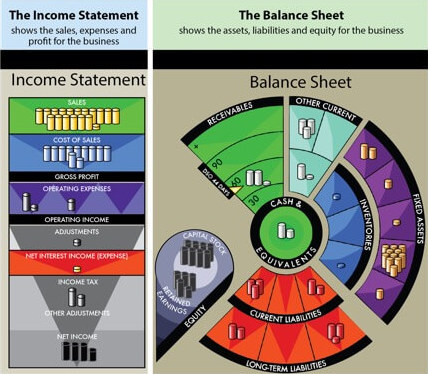
Click here to learn how to read the Visual Finance presentation of Financial Statements.
Don't see the company you want? Contact us to request a company be added to the Visual Finance database.
- The company must be Publicly traded.
- Please include Ticker Symbol and Exchange.
- The reporting structure of banks and other financial companies is not compatible with the Visual Finance App.
| Company | Country | Exchange |
|---|---|---|
| {{company.country}} | {{company.exchange}} |

Visual Finance is the foundation of the Income|Outcome business simulations which use experiential learning to increase business acumen.
Income|Outcome workshops are tailored to meet the needs of the audience. Program lengths 4-20 hours. Online or in-person. Custom Industry models available.