Reading Visual Finance
The Income Statement Equation
Sales - Expenses = Profit
The Balance Sheet Equation
Assets = Liabilities + Equity
Sales and other revenues (e.g. Investment or Adjustments):
Represented by gold stacks
Cost of Goods Sold (or Cost of Sales):
Represented by blue stacks.
Cash Expenses:
Represented by silver stacks.
Depreciation:
Represented by copper stacks.
Net Income (Profit for the period):
Represented by black stacks. (A loss is outlined in red)
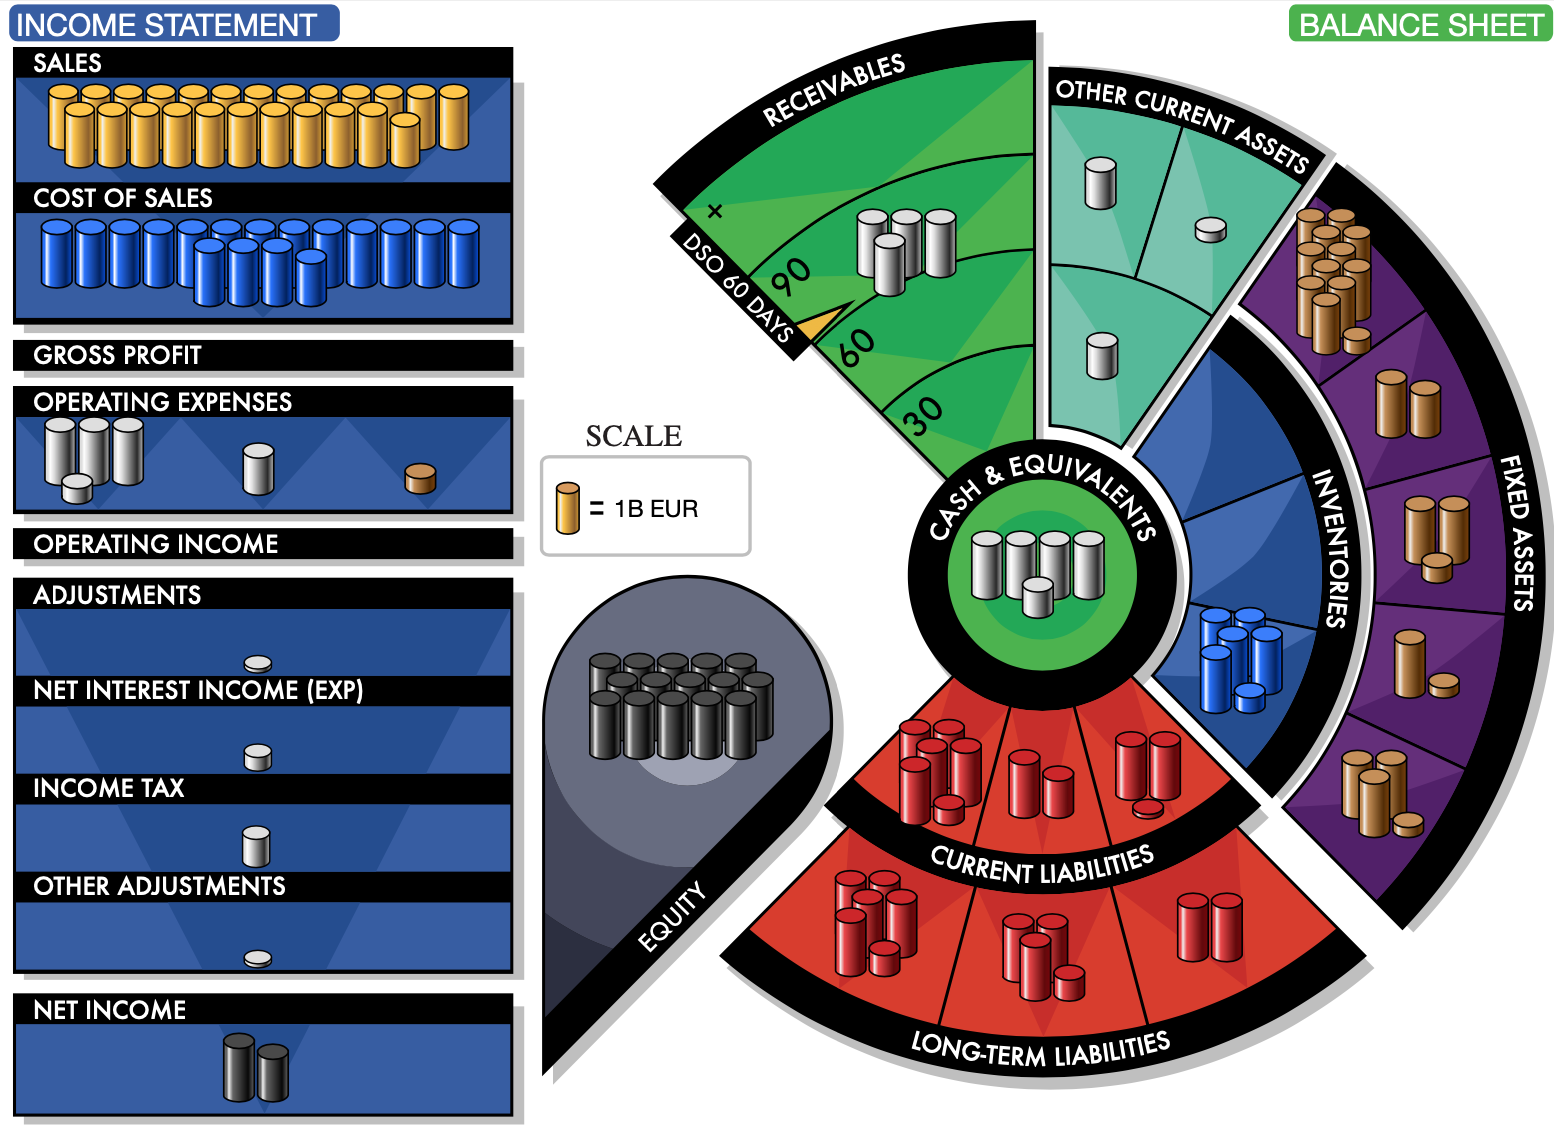
Current Assets
Inventories:
Represented by blue stacks.
Cash, Receivable, and Other:
Represented by silver stacks.
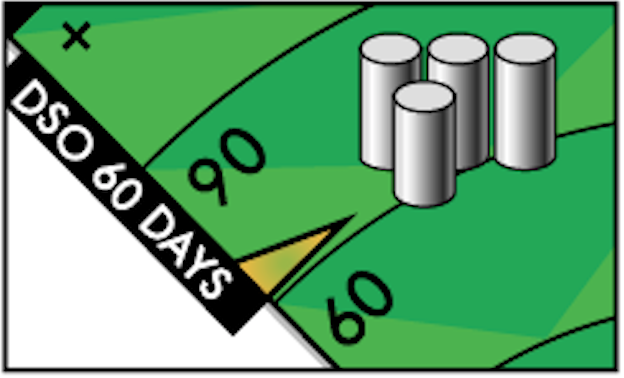
Days Sale Outstanding
is automatically calculated
Fixed Assets:
Represented by copper stacks.
Liabilities:
Represented by red stacks.
Equity:
Represented by black stacks.
(Negative equity is outlined in red)
Visual Finance is the foundation of the Income|Outcome business simulations which use experiential learning to increase business acumen.
Income|Outcome workshops are tailored to meet the needs of the audience. Program lengths 4-20 hours. Online or in-person. Custom Industry models available.
Key Ratios in Visual Finance
Return on Sales
(Profitability Ratio)
ROS shows what percentage of the sales revenue is left after you have paid costs and expenses.
ROS = Net Income/Sales x 100%
Return on Assets
ROA measures how effectively the assets are employed in the business.
ROA = Net Income/Assets x 100%
A Visual Finance look at: Michelin (France) (MGDD Y) Dec 2021
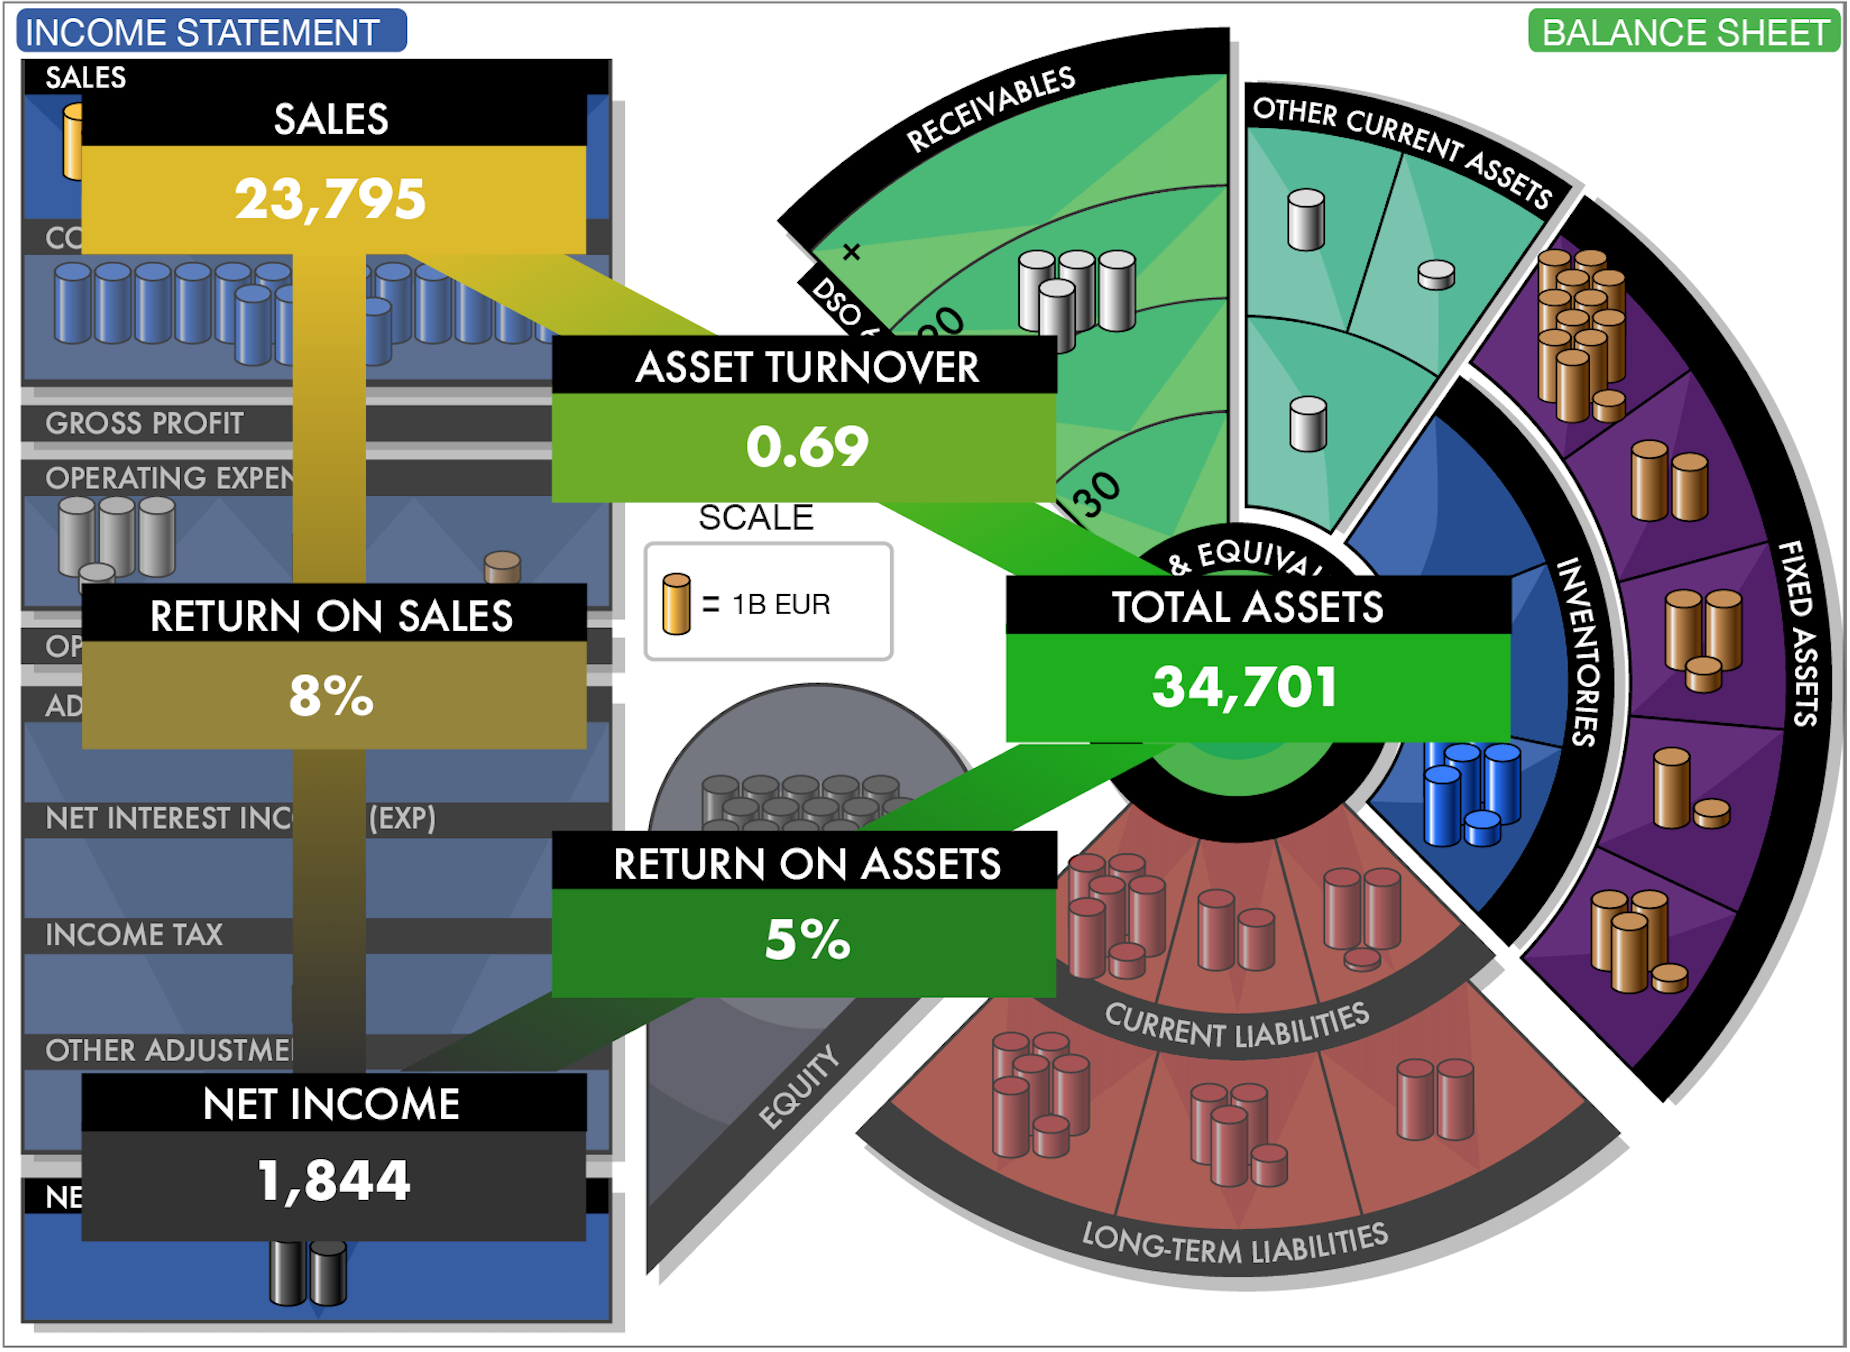
Asset Turnover
(Asset Turns)
Asset Turnover tells you how many times you ‘turned over’ your assets during the period.
ATO = Sales/Assets