Visual Finance
Making the connection between the P&L and the Balance Sheet
With Visual Finance you can browse up to 30 years of annual financial reports for over 600 publicly-traded companies from around the world. Select a company by name or stock symbol. Instantly view their financial statements as a ‘financial landscape’ where the most important factors leap into view. Instantly identify profit or loss, debt-to-equity ratios, etc. Display key financial ratios with the press of a button. Scroll from year to year to see the company’s evolution. PDF the image to share with colleagues.
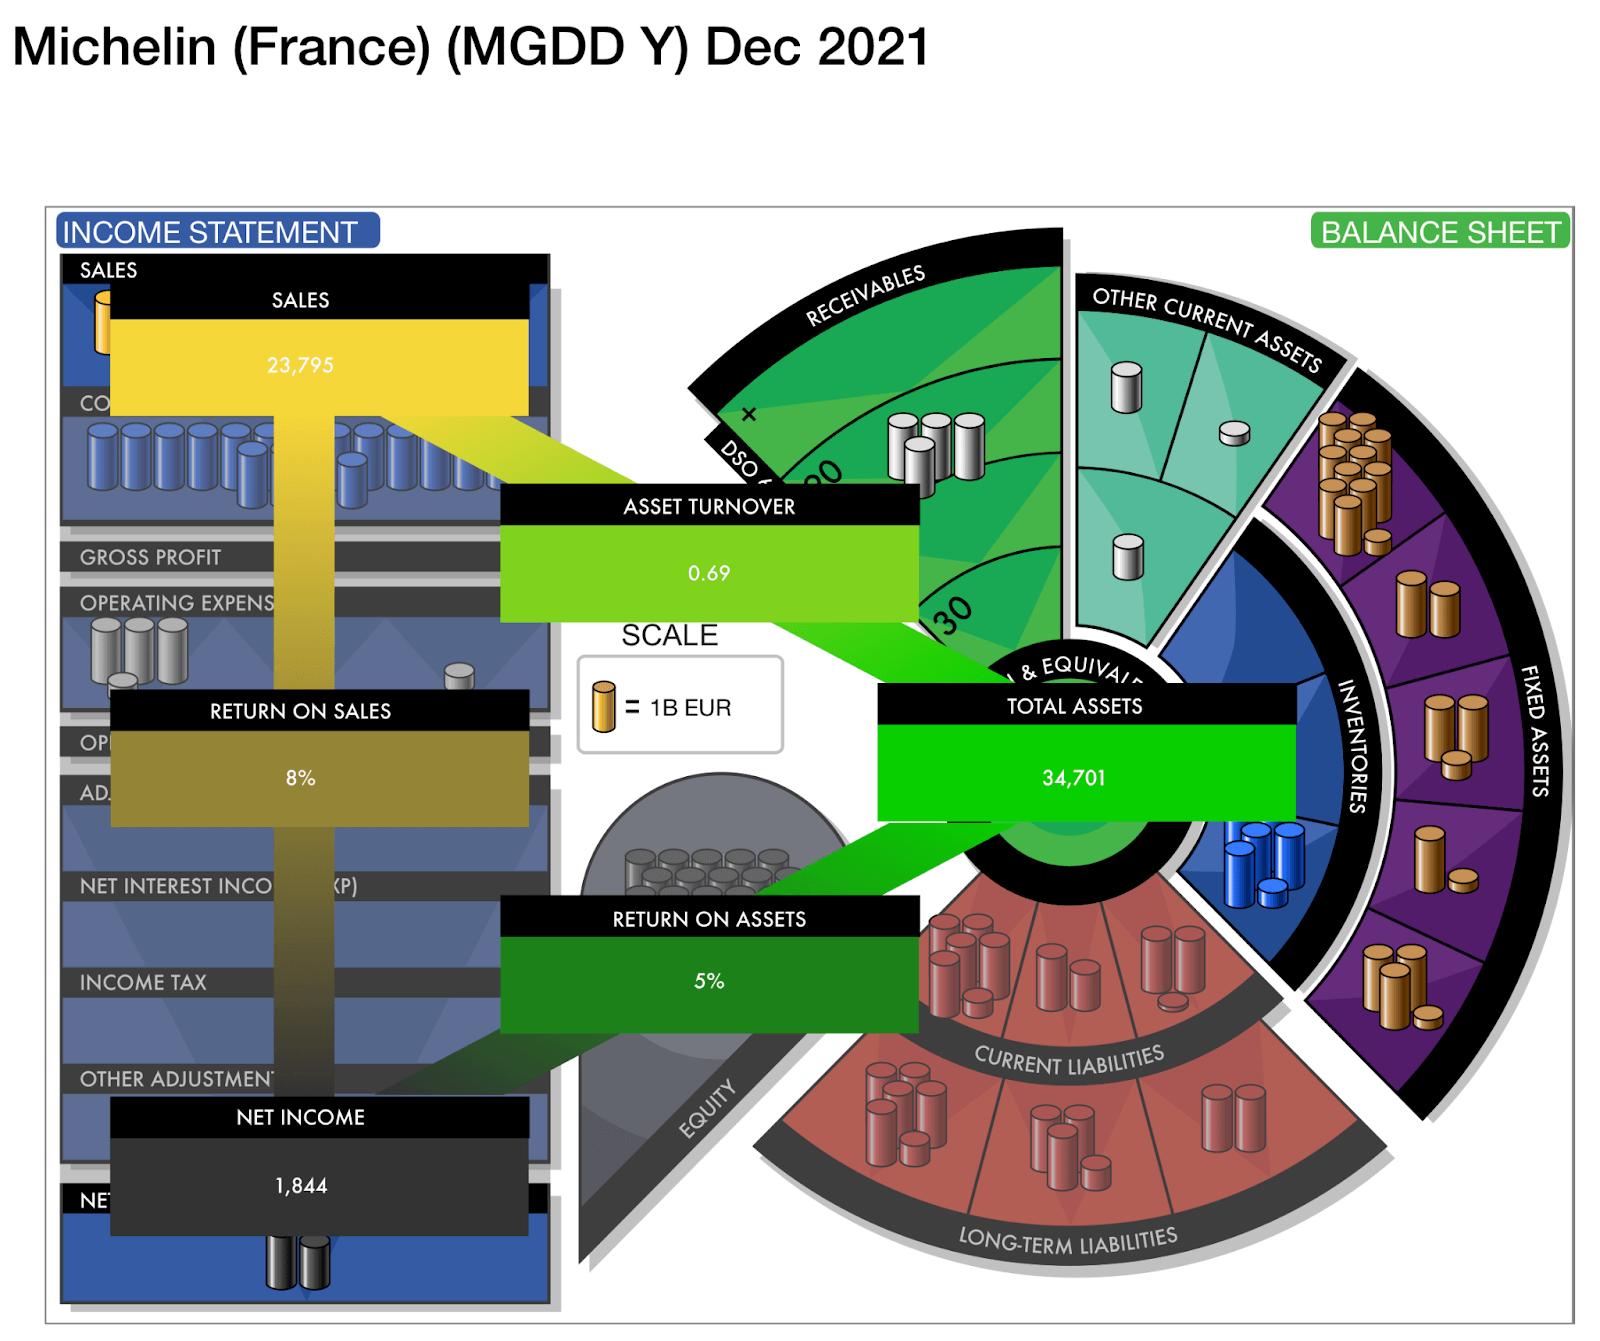
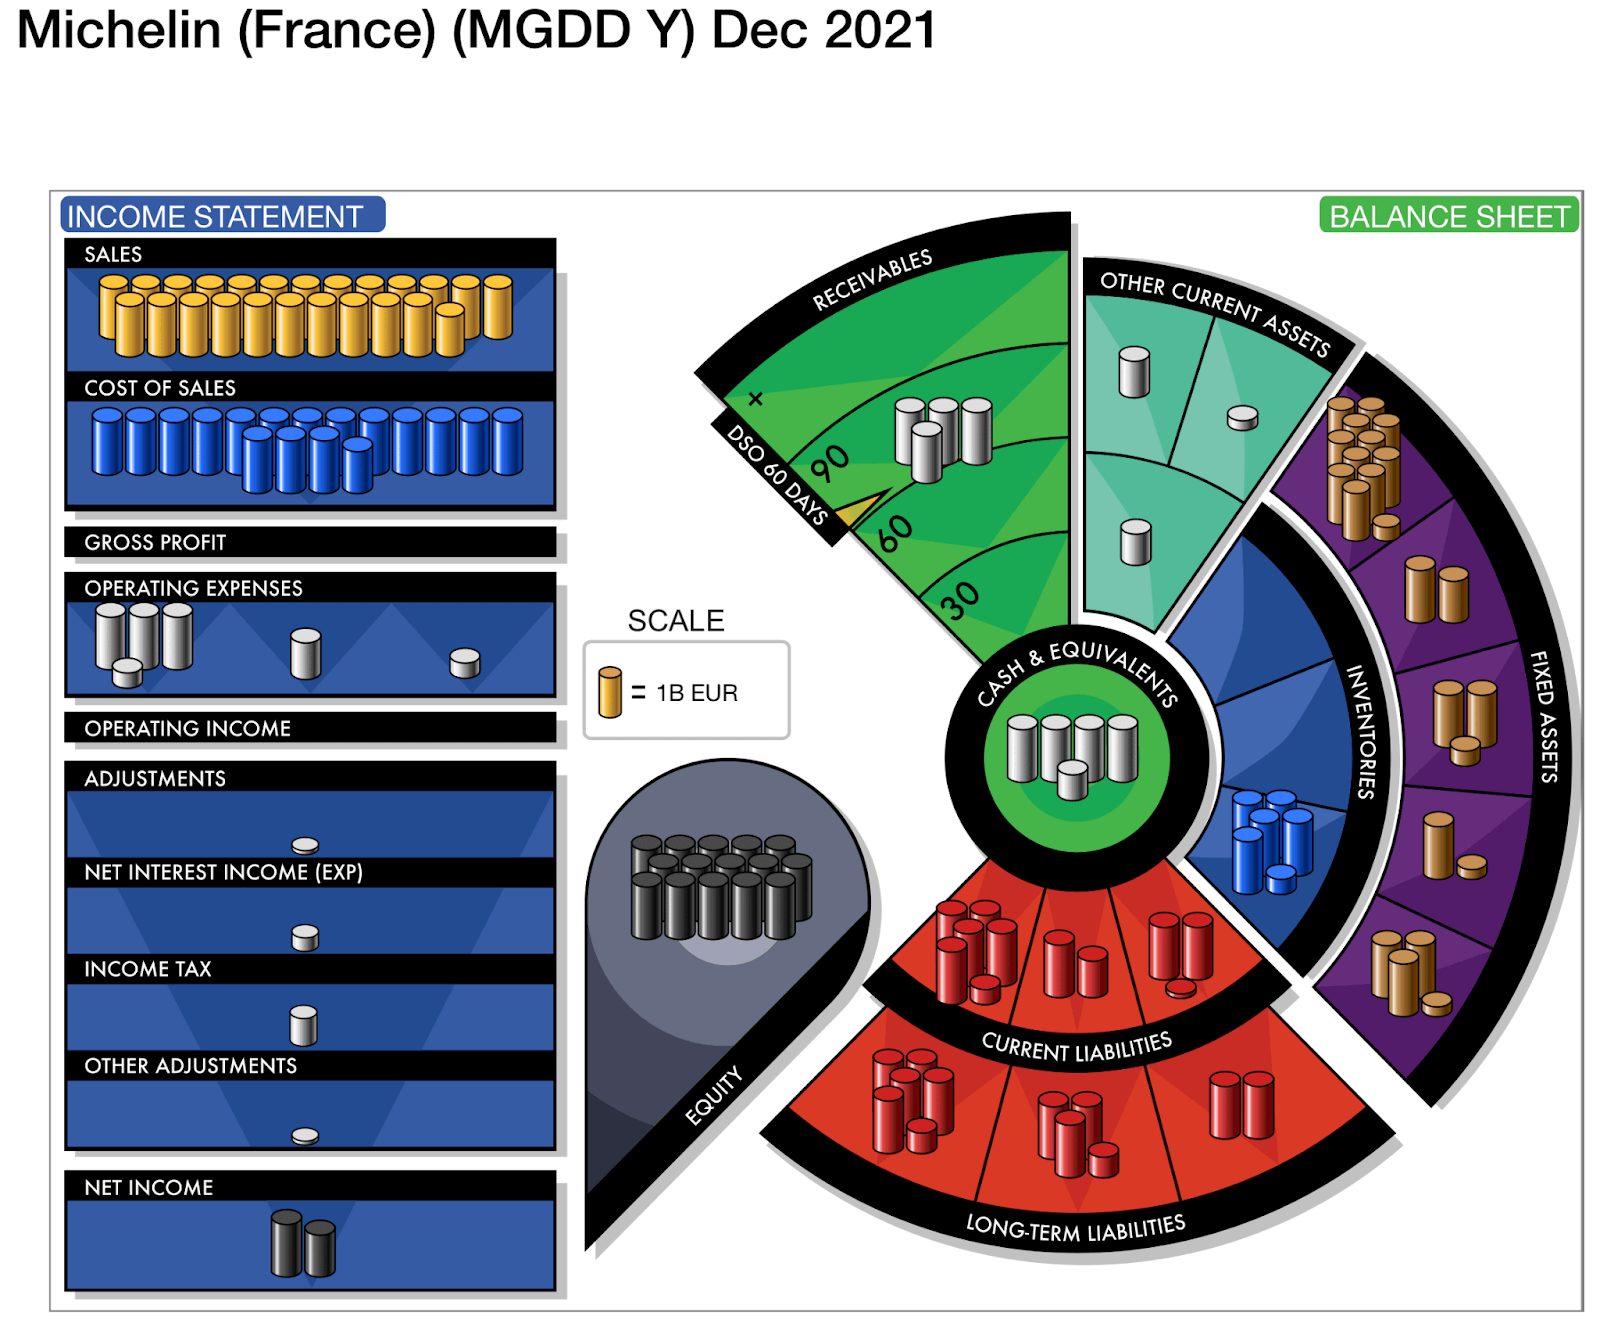
The Visual Finance view of a company's financial statements focuses on the structure and health of the company. It provides a visual understanding of profits, ratios, leverage, working capital, etc. It does NOT focus on issues of location, currency or comparative size.
Visual Finance was developed by Andromeda Simulations International, Ltd., drawing on the Income|Outcome® business simulation model used since 1996 by organizations such as Michelin, Beam Suntory, and Schneider Electric, as well as EMBA programs at Berkeley Haas, the University of Minnesota, and Purdue.
About Income|Outcome® Business Simulations
Income|Outcome® is a family of board game business simulations that develop business acumen in a fun and engaging way. It is available for all levels of workforce and management. Benefits include greatly improved business understanding and decision-making, as well as enormous increases in communication, morale and support for senior management. Available for in-person and online workshop.
The game uses a Visual Finance representation of financial statements and focuses on operational management dynamics.
Experience experiential learning!